Chart
The Chart class offers a built-in and ready to use control to easily display a graphical representation of data. Chart supports five type of graphs representation: Bar, Pie, Line, Area and Scatter.
Best practices
- Select the chart type that represents better your data. You can change a chart from one type to another—for example, from a pie chart to a bar chart, or from a line chart to an area chart.
How to use
- Drop a
Chartcontrol from the object panel to aWindow - Use the
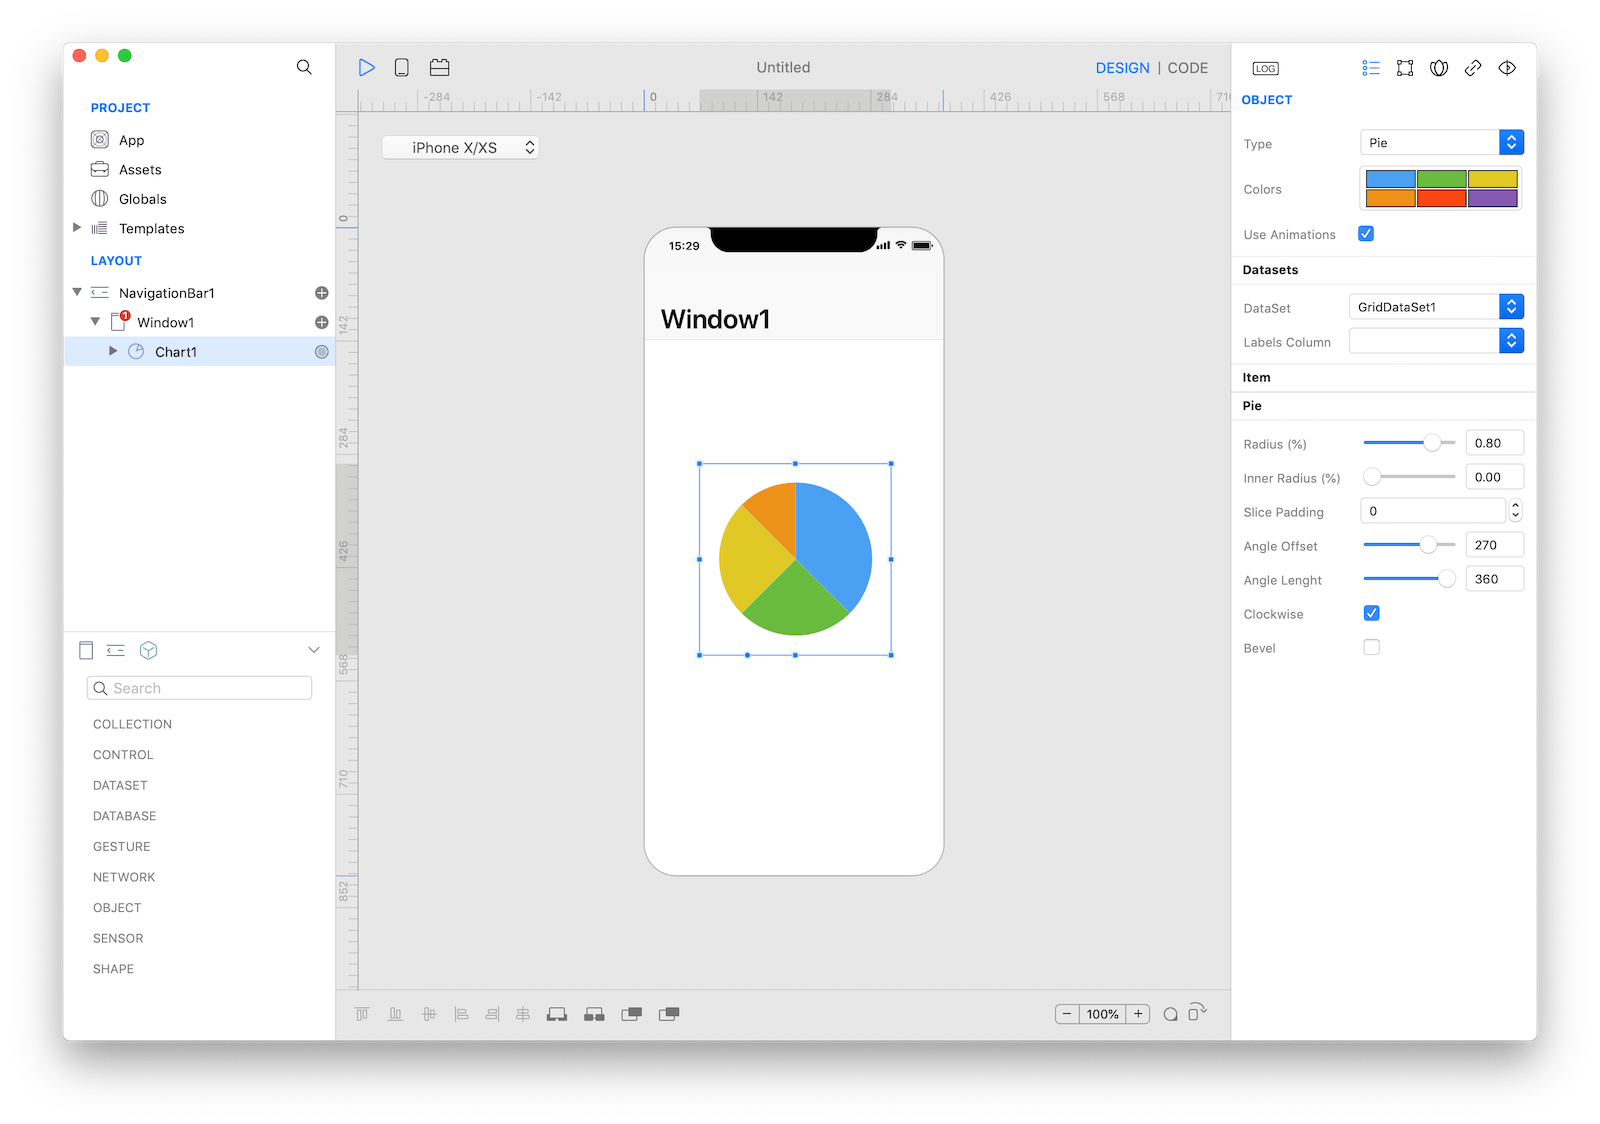
Chart Inspectorto customize its properties likeType,Colors, andDataSet
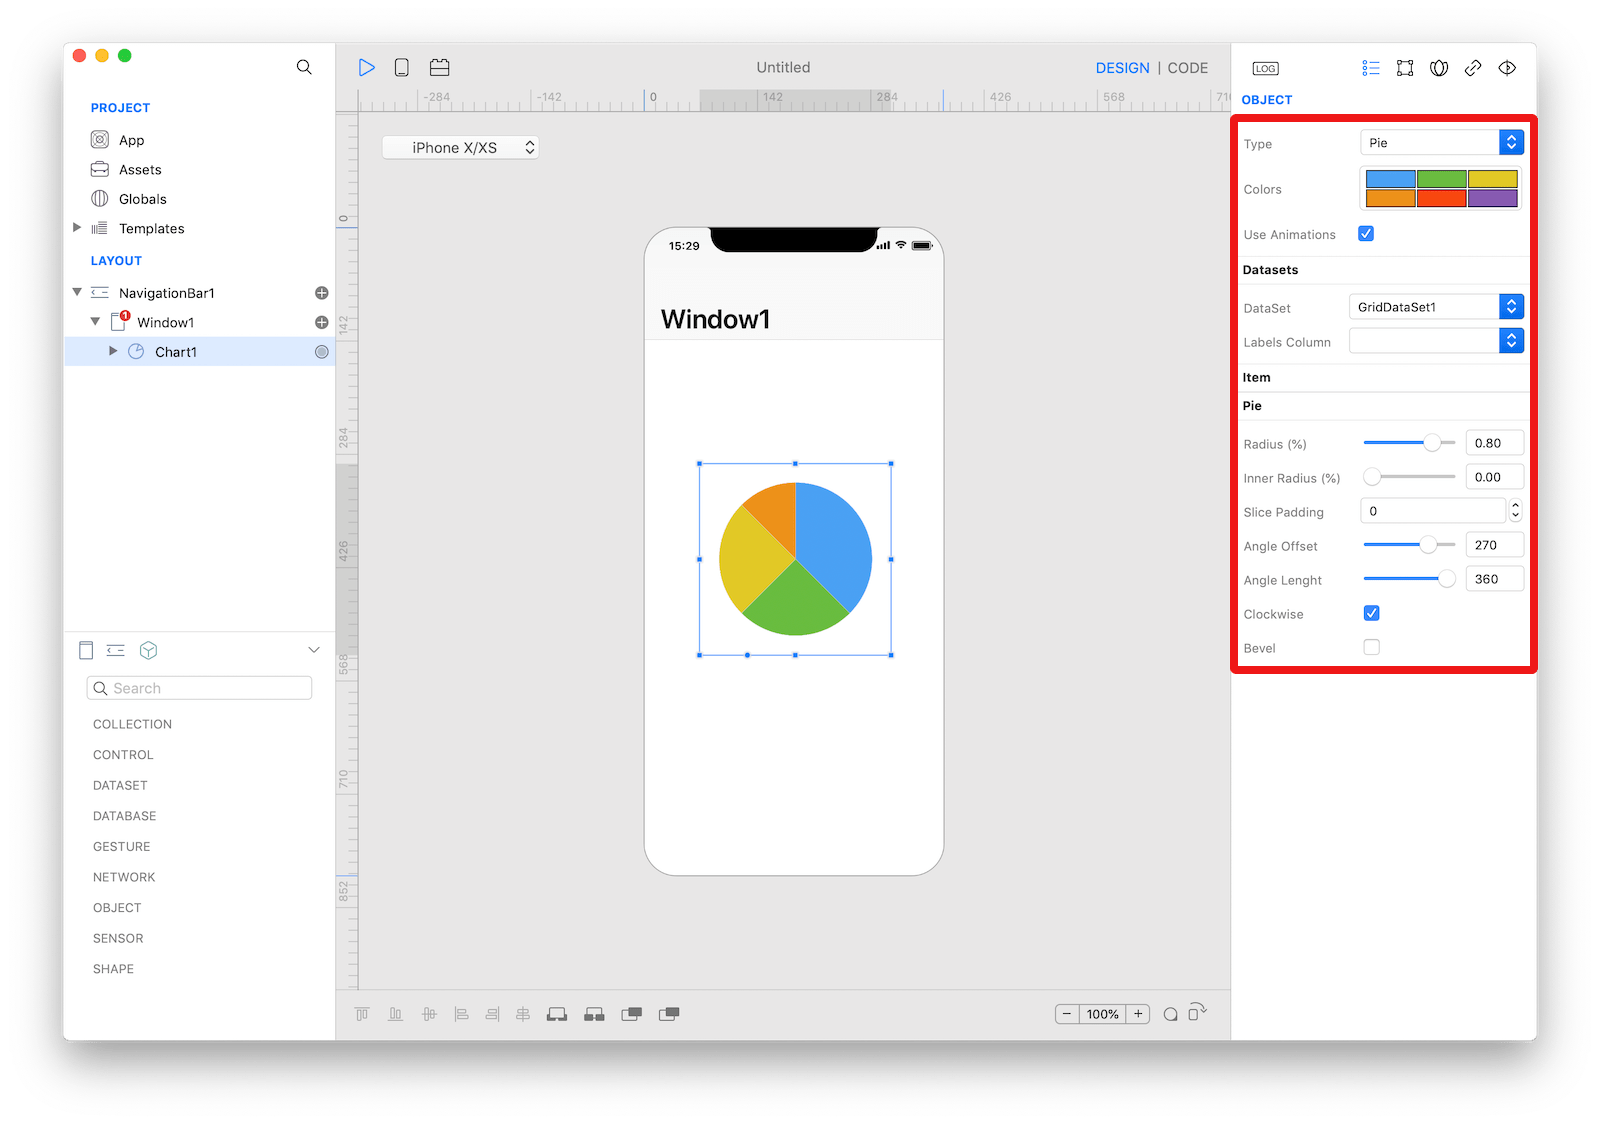 The inspector where the
 Chart class can be configured.
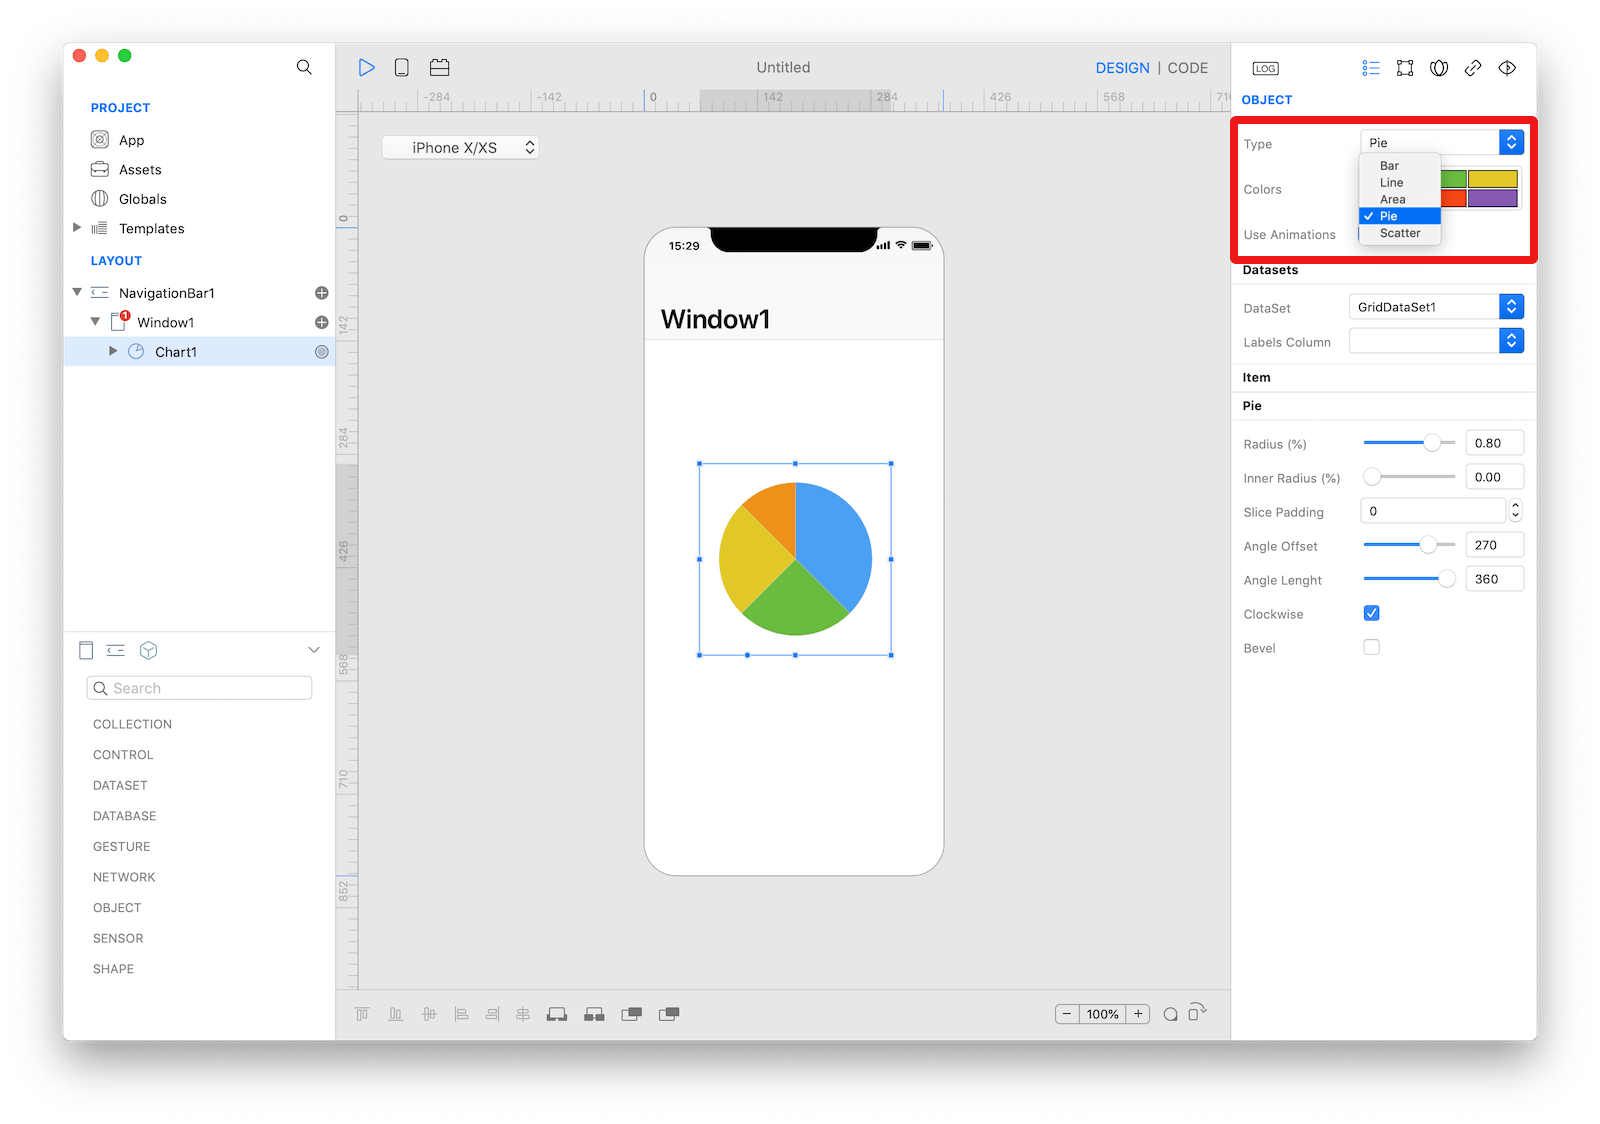 The
The Chart types.
Example
- Drop a
Buttoncontrol from the object panel to aWindow - Open the
Code Editor - Select the
Actionitem inside theEventsarea and write your custom code in theCode EditorChart1.chartType = ChartType.Area
Most important properties
Several UI aspects can be configured in the Chart class but the chartType and dataSet are the most commons to be configured.
chartType: The graphical representation typedataSet: TheDataSetobject provides information that Chart needs to construct its content.
References
Chart class reference contains a complete list of properties and methods that can be used to customize a Chart object.